
Abstract
As the frequency of extreme weather events increases, the cost of climate change is becoming more evident by the year. Superstorm Sandy, Hurricane Harvey, and Hurricane Ida are just three recent examples that show how costly these major events can be for society, leading to power outages and affecting normal business operations for the power delivery industry. Because of this, it is necessary for utilities to make the existing transmission systems more robust to mitigate these disruptions and extreme recovery costs. This paper seeks to quantify the costs for upgrading power delivery infrastructure by developing a cost analysis study for a ten-mile segment of a 345kV double circuit transmission line. The line consists of tubular steel poles and lattice towers designed for four extreme weather events characterized by four different wind speeds (140 mph, 150 mph, 165 mph, and 180 mph). The transmission structures consist of dead-end lattice towers, tangent lattice towers, and tangent tubular steel poles. The structures are installed on drilled pier foundations. The structures and foundations are designed for each of the four extreme wind events, and their design, material, fabrication, and construction costs for the four cases are calculated. Finally, the study compares the costs and reliability between the four options to draws some conclusions on the results
1. Introduction
Hurricanes are powered by heat energy in the ocean’s surface layer. As global temperatures increase due to climate change, there is an increase in frequency and intensity of hurricanes (Emanuel, 1987; Banholzer, 2014). The current ASCE 74 – 20 recommends structures to be designed for extreme wind loads with 100 year Mean Recurrence Interval (MRI). However, the 100 year return period may not be enough for the everincreasing intensity of hurricanes and we may need to increase the return period used to calculate the design wind speed. The purpose of this paper is to estimate the increased material, fabrication, and construction costs due to the changes in design wind speeds.
This paper will explore the increased costs associated with the higher design requirements for a sample ten mile, 345kV double circuit transmission line consisting of lattice towers and tubular steel poles installed on drilled pier foundations. To understand the impact of higher wind speeds, the transmission line is designed for four extreme wind speeds – 140 mph, 150 mph, 165 mph, and 180 mph. Material and construction costs are estimated based on structure design weight. The paper compares the cost impact and reliability of higher design wind speeds and draws some conclusions.
2. Methodology
For this study, a sample ten mile, 345kV, double circuit transmission line consisting of tubular steel poles and lattice towers is considered. The poles and lattice towers are installed on drilled pier foundations. The transmission line is assumed to be constructed along the gulf coast in Louisiana. ASCE 74 – 20 recommends a maximum basic wind speed of 140 mph along the Louisiana gulf coast. This criteria is modified to include three additional wind speeds 150 mph, 165 mph, and 180 mph for simulating the increasing intensity of the extreme wind events.
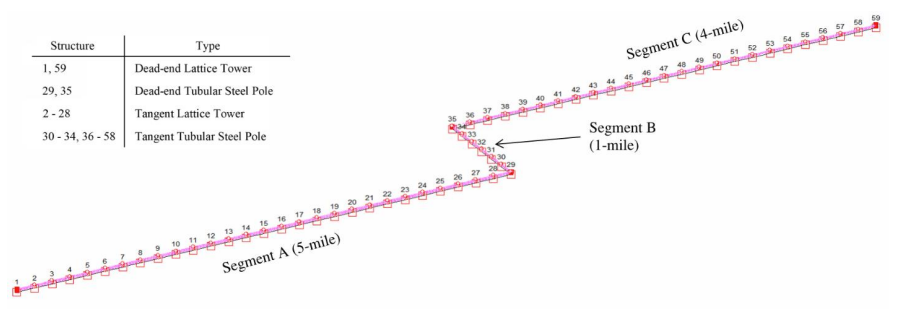
Several transmission lines surveyed along the gulf coast in Texas and Louisiana had span lengths of 600 to 1000 feet. Hence for simplicity, all span lengths are assumed to be equal at 880 feet. The transmission line is divided into three segments as shown in Figure 1. Segment A is 5 miles long and starts with a dead-end lattice tower (Str # 1) followed by 27 tangent lattice towers (Str # 2 to 28). The last structure on this segment (Str # 29) is a dead-end tubular steel pole. Segment B is aligned at 90° and consists of tangent tubular steel poles (Str # 30 to 34) ending with a dead-end pole (Str # 35). Segment B is 1 mile long. Segment C is 4 miles long and is aligned at 90° to segment B and consists of tangent tubular steel poles (Str # 36 to 58) ending with a lattice dead-end tower (Str # 59). The transmission line has a double circuit bundled conductor (2 wire bundle) with two shield wires. The conductor is assumed to be 1590 kcmil “Falcon” ACSR and ground wire is assumed to be 3/8 EHS steel.
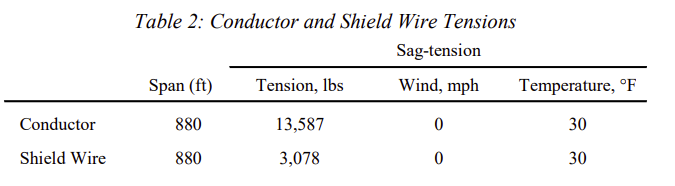
The properties of conductor and shield wire are shown in Table 1. The conductors are strung to meet clearances above ground as per National Electrical Safety Code – 2017 (NESC 2017) standard. Conductor tension values listed in Table 2 are used to meet these clearances. The cables are auto sagged at 30°F weather case, the conductor is strung at 25% and the shield wire is strung at 20% of their ultimate breaking strengths.
All tubular steel poles are assumed to have a uniform structure height of 150’ and all lattice towers are assumed to have a uniform structure height of 170’. All tangent structures are designed with V-string insulators and all dead-end structures are designed with strain insulators. The phase-to-phase and conductor to structure clearances are set as per NESC 2017 standard.
Following clearances are maintained for tangent towers
- Horizontal phase-to-phase spacing – 37’-4”
- Vertical phase-to-phase spacing – 30’-6”
- Shielding angle – 20 deg
Following clearances are maintained for Dead-end towers
- Horizontal phase-to-phase spacing – 47’-0”
- Vertical phase-to-phase spacing – 28’-4”
- Shielding angle – 20 deg
Table 1: Conductor and Shield Wire Properties
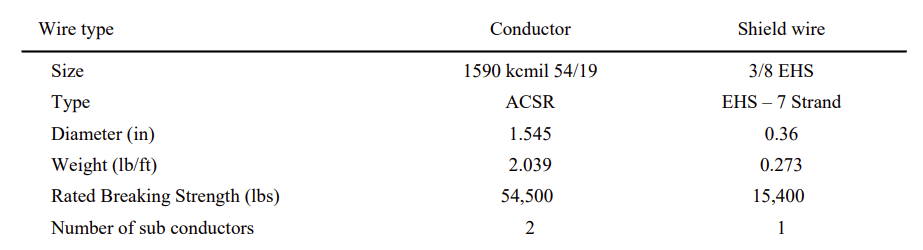
Table 2: Conductor and Shield Wire Tensions
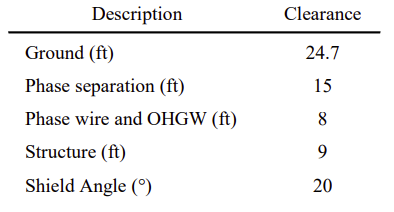
The minimum requirements for clearances and spacing are shown in Table 3. Values in Table 3 are based on NESC 2017 for 345 kV transmission.
Table 3: Clearance values for 345 kV transmission line from NESC 2017
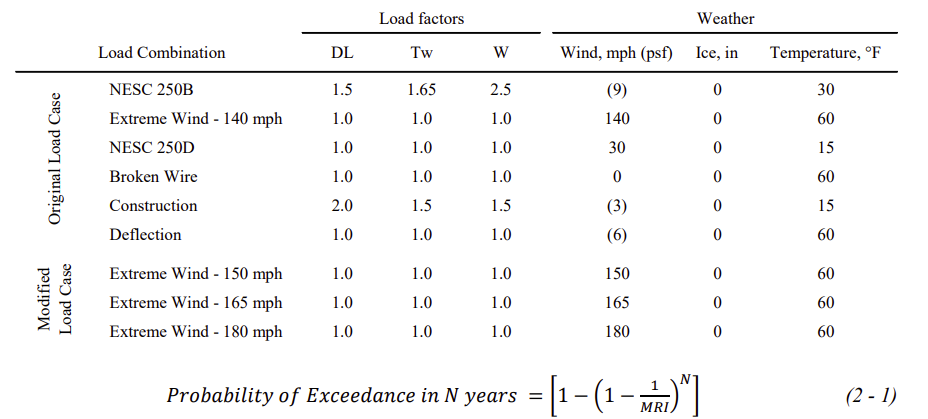
The structures are designed for NESC rule 250B, 250D, extreme wind speeds, broken wire condition (two phases broken at a time), construction, and deflection load cases. The deflection limit for poles is set to 1.5% of the pole height. The load factors and weather cases are detailed in Table 4. A PLS-CADD model is developed for the transmission line with Method 4 models. Load files from this model are used in the design of structures.
Wind speeds presented in ASCE 74-20 are based on a 100-year Mean Recurrence Interval (MRI). In this paper, design wind speeds corresponding to MRI values of 100, 300, 700, and 1700 are selected for analysis. The wind speed corresponding to MRI values of 100, 300, 700, and 1700 are 140 mph, 150 mph, 165 mph, and 180 mph respectively along the gulf coast of Louisiana (ASCE 7 – 16).
The reliability of transmission lines can be increased by increasing MRI values. Higher wind speed used for design corresponds to higher MRI values. Increasing MRI values lowers the probability of exceedance of extreme weather events. The probability of exceedance of a particular extreme weather event in N years is given by equation 2 – 1 (ASCE 74-20).
Table 4: Load cases and load combinations considered for analysis. The extreme wind loads are calculated according to ASCE 74 – 20
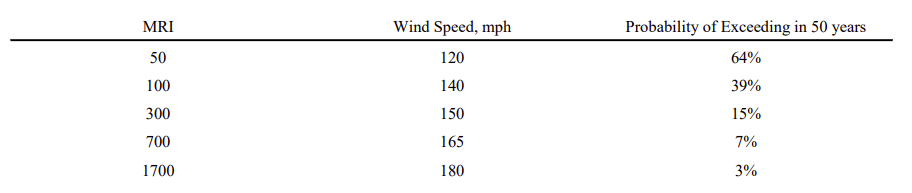
Reliability of design is defined in terms of the probability of exceeding of an extreme weather event at least once in a 50-year interval. The reliability for each MRI is shown in Table 5. It is important to note that MRI values vary spatially. Therefore, reliability results are limited to the geographic location selected for this study.
Table 5: Reliability defined as probability of exceedance over 50 years for different MRI values.
3. Design
3.1 Design of Tubular Steel Poles
The tubular steel poles are designed to carry 345 kV double circuit bundled conductors. Structural steel conforms to ASTM A572 Grade 65. The poles are comprised of 12 sided flats and the pole height is assumed to be 150 feet. The davit arms are inclined down at 15 degrees to the horizontal and are comprised of 8 side flats. The top of the pole has arms for shield wire attachment. For this study, the geometry of the pole is kept constant for all wind speeds and is shown in Figure 2.
A drag coefficient of 1.0 is used for the pole and 1.4 for davit-arms as per ASCE 74 – 20. V-String insulators are used on all poles. To optimize the pole design, the thickness and distance across flats of the pole and davit-arms are adjusted to minimize the total weight. The pole taper is limited to 0.5 in/ft. The design thickness of pole ranges from 0.25 to 0.875”. The top diameter of pole ranges from 19” to 45” and the bottom diameter ranges from 41” to 120”.
The dead-end pole is 150’ tall and is designed as two single circuit poles. The dead-end pole is designed with dead-end strain insulators with a length of 15’- 6”. Geometry of tangent and dead-end tubular steel pole is shown in Figure 2 (a) and Figure 2 (b) respectively. The poles are designed as per ASCE 48 – 19.
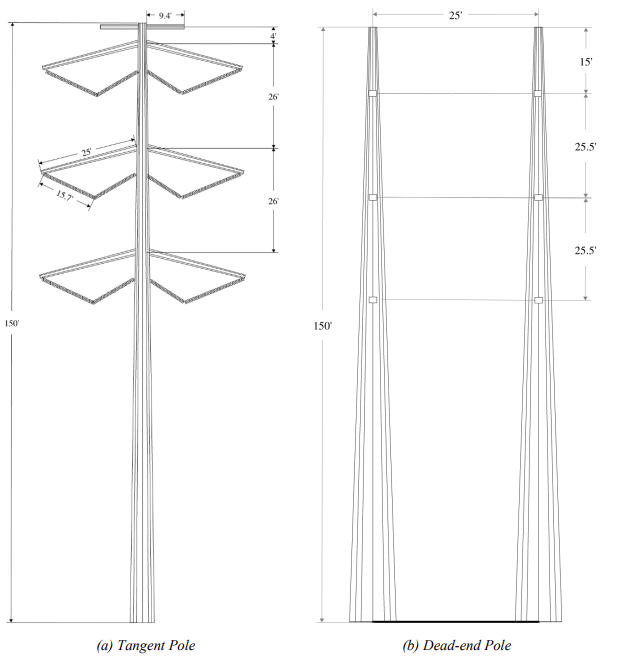
The dead-end pole is designed as two single circuit structures.
3.2 Design of Lattice Steel Towers
Lattice steel towers are designed to carry 345kV double circuit bundled conductors. The steel material conforms to ASTM A572 grade 50. Base width, member sizes and tower geometry are adjusted to optimize the tower weight. The section factors in the TOWER model are adjusted to account for plates, bolts, galvanizing, and the force coefficient. The tower model is analyzed for member strength, crossing diagonal checks, and included angle checks as per ASCE 10-15. All redundant members are included in the TOWER model. The tower geometry is shown in Figure 3.
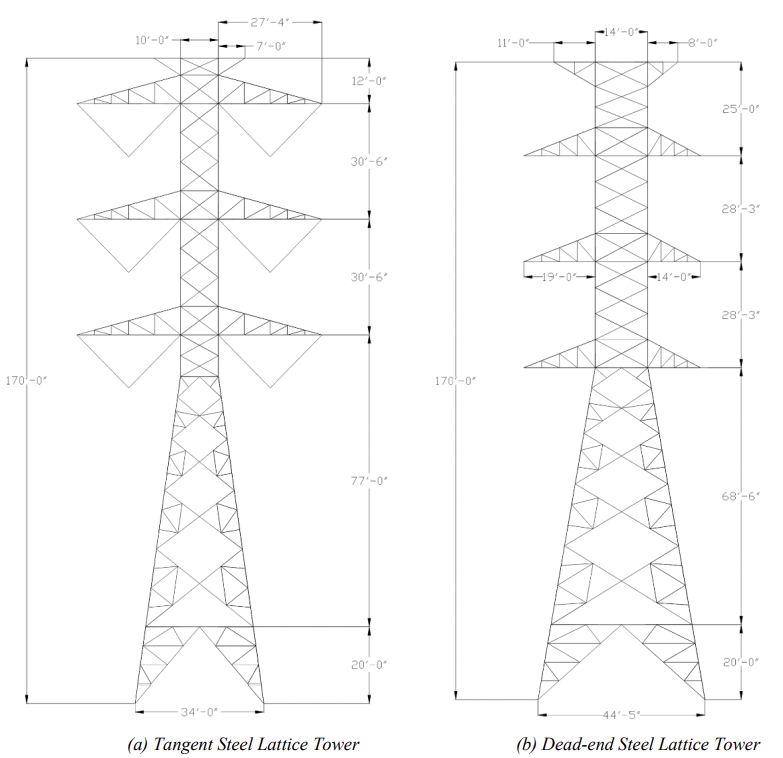
3.2.1 Tangent Towers
Tangent towers have a 34’ wide square base and a total height of 170’. The tower has a shield wire arm projection of 7’-0” and the crossarm projection of 27’-4”. All members are connected using 5/8”, ASTM A394 Type 1 bolts.
3.2.2 Dead-End Towers
Dead end towers have a 44’- 6” square base width and a total height of 170’. They have a left shield wire arm projection of 11’- 0” and right shield wire arm projection of 8’-0”. The left and right crossarm projections are 19’-0” and 14’-0” respectively. All members are designed using 7/8” ASTM A394 Type 1 bolts.
3.3 Foundation design
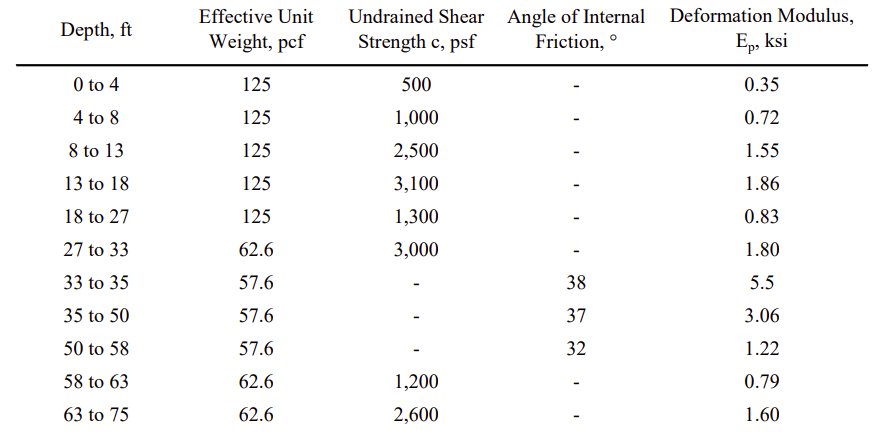
All structures are installed on drilled pier foundations. The soil is assumed to be silty sand and clay. Soil profile properties are shown in Table 6. The foundations are designed for moment, shear, tension, and compression forces. Concrete compressive strength assumed for this design is 4 ksi and reinforcing steel yield strength is assumed to be 60 ksi. The foundations are designed using MFAD software.
Table 6: A Sample soil profile considered for foundation design.
4. Results
The design summary for tubular steel poles, lattice towers and foundations are given in the table 7 to 10 below:
Table 7: Pole Design Summary. The weight listed for dead-end pole includes both single circuit poles.
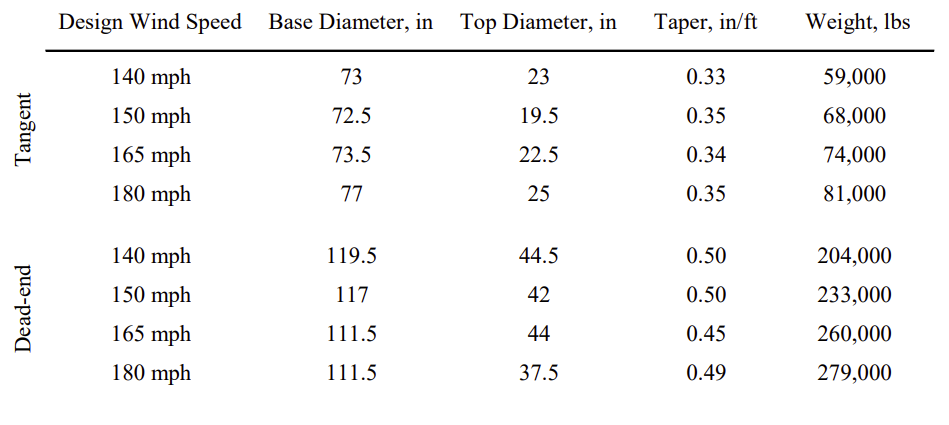
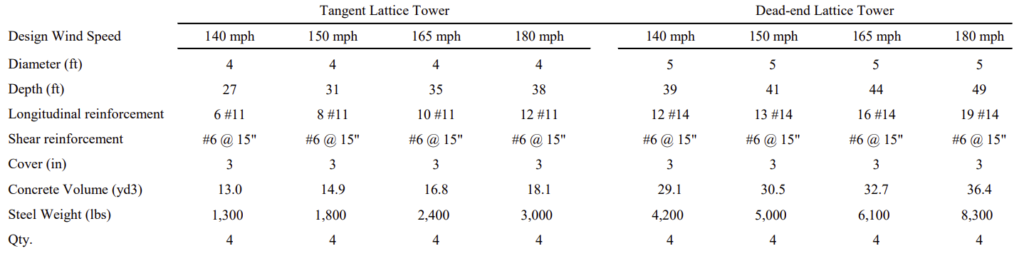
Table 8: Tower Design Summary.
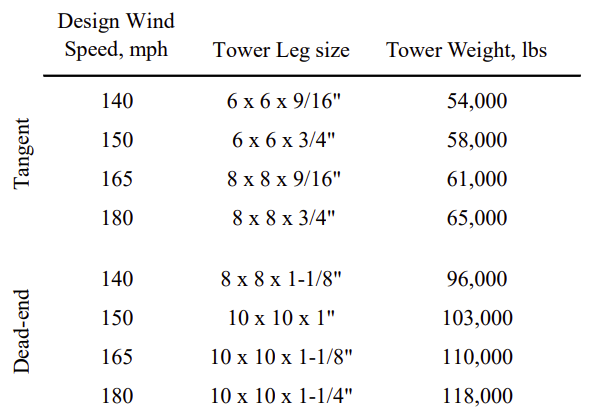
Table 9: Foundation Design Summary for Tubular Steel Poles. All foundations are designed as drilled pier foundations. Tangent structures require one foundation. Dead-end structures are designed as two single circuit poles, so they require two foundations as listed in qty.
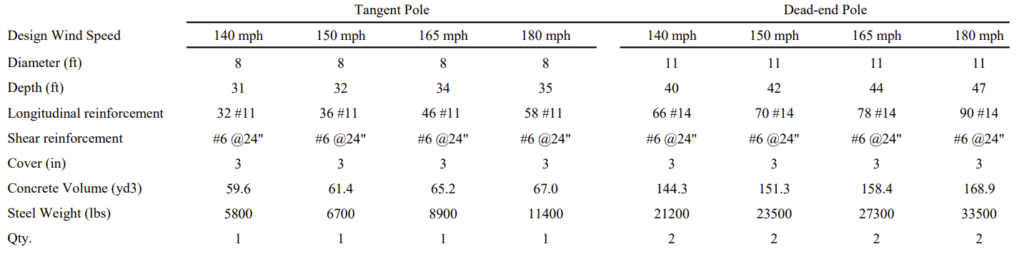
Table 10: Foundation Design Summary for Lattice Towers. All foundations are designed as drilled pier foundations. Each structure requires four foundations (one per leg) as listed in qty.
Based on industry survey for this sample transmission line, the unit cost of material, fabrication, and construction is estimated as $2.75/lbs for tangent tubular steel poles, $2.3/lb for dead-end tubular steel poles, and $4.5/lbs for lattice towers. Construction and material cost for concrete and reinforcing steel for foundations is estimated at $1200/yd3 and $1.6/lbs respectively. Individual structure cost calculated using these estimates is listed in the Table 11.
The percent increase in total structure cost including foundations with respect to design wind speed is shown in Figure 4.
The total cost of transmission line is obtained after multiplying the number of structures in the transmission line with individual structure cost. The cost of transmission line per mile designed for different wind speeds is shown in Table 12. The variation in the cost of transmission line with respect to the design wind speed is represented in Figure 5.
Table 11: Individual Structure Cost. For simplicity, the cost is shown for 140 mph wind design. For all other wind speeds, the cost is shown as percent increase with respect to 140 mph wind design.
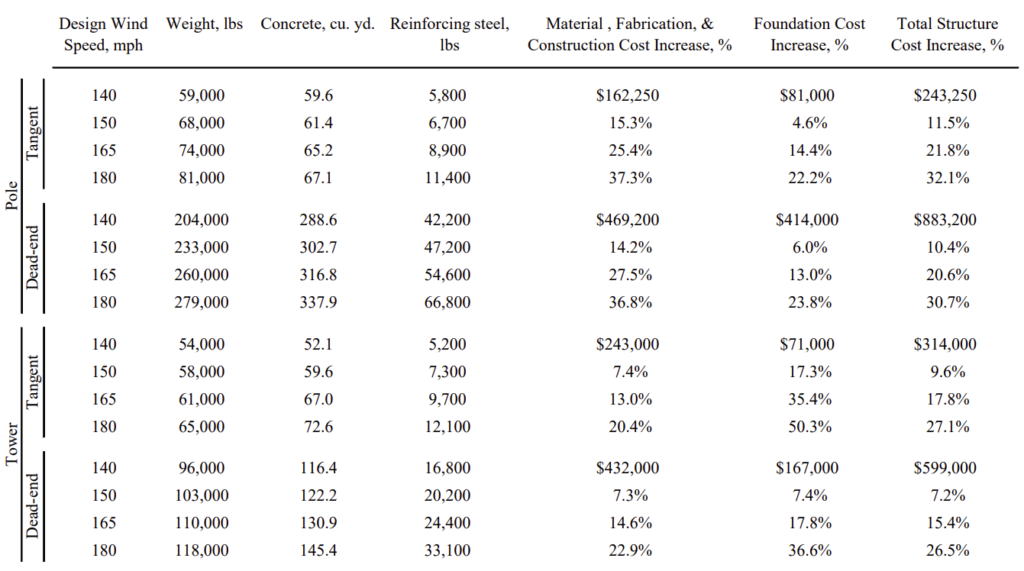
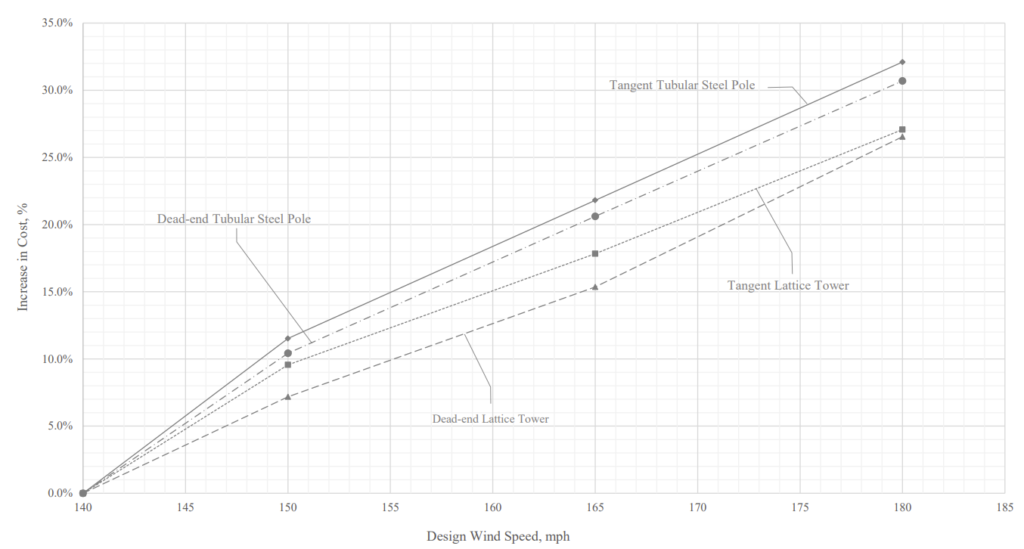
Figure 4: Increase in Total Structure Cost with respect to wind speed. The structure cost at 140mph design wind speed is considered as base cost.
Table 12: Cost of transmission line per mile. The cost for 140 mph wind speed is considered as base cost
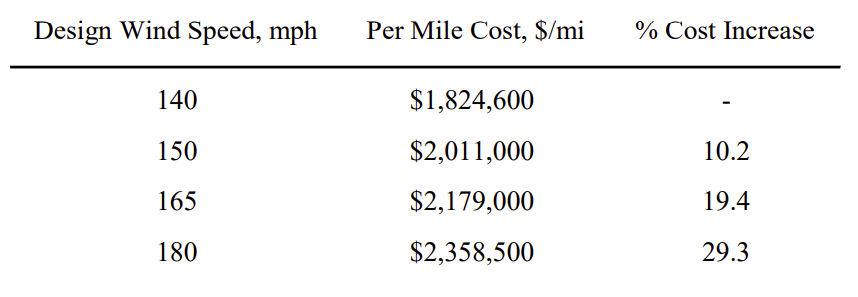
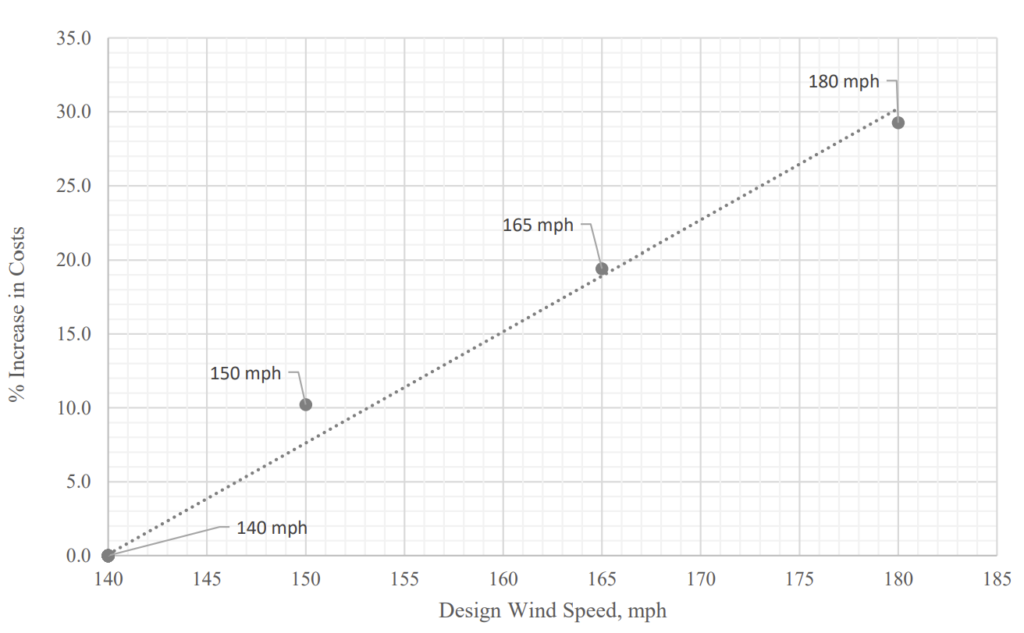
Figure 5: Percent increase in cost per mile of transmission line with respect to change in design wind speed. The cost for 140 mph wind speed is considered as base cost. The cost of transmission line varies linearly with wind speed.
The relationship between the reliability of the structure and its cost is non-linear and is shown in Figure 6. In this figure, the cost of structure designed to withstand an extreme wind speed of 140 mph is considered as a base value. For the geographic location selected in this study, the extreme wind speed of 140 mph corresponds to an MRI value of 100. As shown in Table 5, an MRI value of 100 corresponds to a failure probability of 39% over a 50-year period.
Table 13: Reliability v/s Increase in Cost
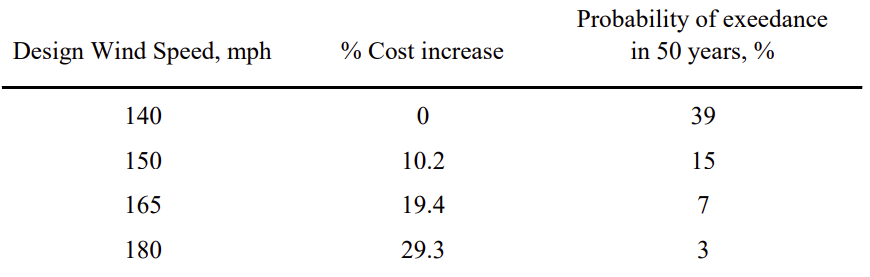
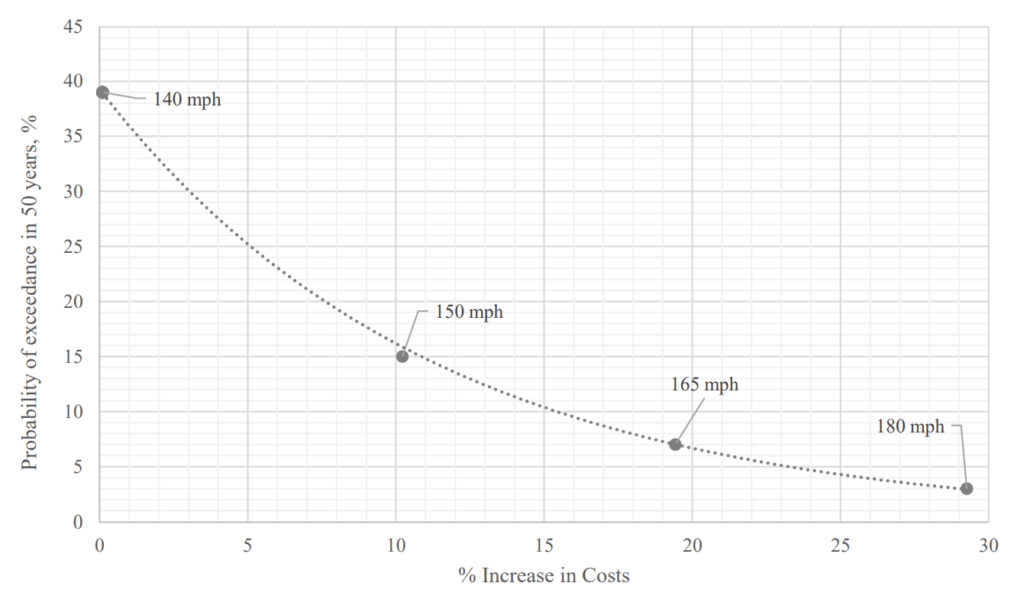
Figure 6: Reliability defined as probability of exceedance in 50 years. The probability of exceedance (failure) decreases exponentially with increase in costs. Therefore, increasing costs by a small amount can increase reliability significantly.
5. Summary
For the sample transmission line in this study, the structure cost increases linearly with increase in maximum design wind speed. This is also applicable for per mile cost of the transmission line. Based on the graph shown in Figure 5, for every 10 mph increase in wind speed over 140 mph, the cost increases by 7%.
If the design wind speed is increased from 140 mph to 150 mph, the MRI increases from 100 years to 300 years and the probability of exceedance over 50 years decreases significantly from 39% to 15%.
Thus, the reliability of transmission infrastructure can be significantly increased with relatively small investments in structural capacities. Figure 6 can also be used to estimate the increase in cost when designing for a target reliability.
References
[1] ASCE (2015) – “Design of Lattice Steel Transmission Structures”. ASCE 10-15, Reston, VA.
[2] ASCE (2019) – “Design of Steel Transmission Pole Structures.” ASCE 48-19, Reston, VA.
[3] ASCE 74 (2020) – “Guidelines for Electrical Transmission Line Structural Loading.” ASCE 74-20, Reston, VA.
[4] Banholzer, S. (2014). The impact of climate change on natural disasters. In Reducing disaster: Early warning systems for climate change. Springer, 21-49.
[5] Emanuel, K. A. (1987). The dependence of hurricane intensity on climate. Nature, 483-485.
[6] NESC 250C (2017) – “National Electric Safety Code”. IEEE Standards Association.